 i
Museum of Modern Art (MoMA) · Midtown Manhattan
Full Disclosure: The Edge of Information Design
MoMA's first exhibition devoted entirely to information design, presenting 30 works of digital and analog design — including six new acquisitions — that explore how designers help visualize and shape our understanding of complex data.
More in New York
The first thing you meet is a band of vertical stripes shading from deep blue to bright red, one per year since 1850. That is climatologist Ed Hawkins's Warming Stripes. Fast Company saw a gorgeous rug and a huge warning sign.
About 30 works fill a windowed gallery on MoMA's ground floor, all but one from the collection. They range from new prints extending W.E.B. Du Bois's 1900 data portraits to New York Times 3D reconstructions of Notre Dame and Tulsa's Greenwood neighborhood, and Kate Crawford and Vladan Joler's Calculating Empires covers three walls of a side room. You move between screens you can work through and Dear Data, hand-drawn postcards two designers mailed each other across the Atlantic. Curator Paola Antonelli wants you to leave reading every chart with "more critical eyes."
Come if you make or read charts. The catch is Calculating Empires, dense on purpose: Galerie's writer argues its density "is the argument." It's included with admission ($30 adults, 16 and under free) until June 13, 2027.
Look for
Warming Stripes
The first piece in the show: one stripe per year since 1850, sliding from deep blue to bright red as the global average temperature climbs.
Calculating Empires
Icons and text cover three walls of a side room, tracing technology and power from the Gutenberg press to now.
Dear Data postcards
Ink-and-pencil postcards Giorgia Lupi and Stefanie Posavec sent between New York and London, each one a hand-drawn chart of a week in their lives.
The Synthetic Memories Archive
AI-generated pictures of memories that were never photographed hang on the wall, with the real people's prompt texts printed underneath.
Two Sides of the Same Coin
A model mapping human-associated microbes on one side and more than 12,000 years of global land use on the other.
Good for
- Nerding Out
- Teenagers
Skip if
You want paintings or sculpture: this is charts, maps, screens and postcards.
Also at Museum of Modern Art (MoMA)
On now nearby

Nearby
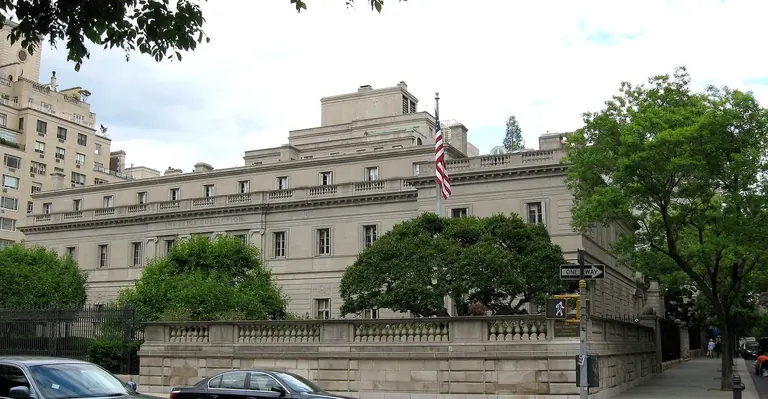

Image credits
7
- Full Disclosure: The Edge of Information DesignCourtesy of Museum of Modern Art (MoMA)
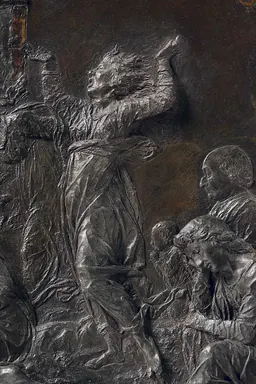
- Siena: The Art of Bronze, 1450-1500The Frick Collection
- Luminous ColorCourtesy of The Morgan Library & Museum
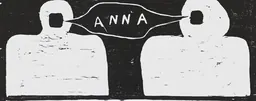
- Anna Maria Maiolino. ANNA—And the Infinite LineCourtesy of Hauser & Wirth
- Museum of Modern Art (MoMA)hibino via Wikimedia Commons, CC BY 2.0
- The Frick CollectionJim.henderson / Wikimedia Commons, Public domain
- The Morgan Library & MuseumMike Peel, CC BY-SA 4.0