What analytics can AI audio guides provide that traditional audio guides cannot?
AI audio guides capture conversational data — what visitors ask, where they get curious, what topics generate follow-up questions. This goes far beyond play counts and stop-level usage. Museums can map visitor interests, identify content gaps, and get direct feedback on exhibits without running a single survey.
How can audio guide data help with exhibition planning?
By analyzing what visitors ask about most, museums can identify high-interest topics for future exhibitions, discover which objects generate the most curiosity, and spot underserved areas where more content would improve the experience. The data comes from real visitor behavior, not self-reported survey responses.
What is a good completion rate for a museum audio guide?
It depends on the tour length and museum type, but most traditional audio guides see significant drop-off after the first few stops. More useful than a single completion percentage is understanding where drop-off happens and why — which requires engagement data, not just play/pause tracking.
Can audio guide analytics help with museum operations beyond content?
Yes. Visitor questions reveal operational issues that have nothing to do with exhibits. If visitors in a specific gallery frequently ask about restrooms, the wayfinding signage needs work. If questions about the gift shop spike near certain exhibits, that's a merchandising signal. The audio guide becomes an ambient feedback channel for the entire visitor experience.
Your audio guide was played 12,000 times last month. What does that tell you?
Almost nothing. You know 12,000 sessions started. You don't know how many were useful, where people lost interest, what they wanted more of, or whether the experience actually worked. "Number of plays" is the museum equivalent of counting website hits in 2004: a number that goes up, makes a nice chart, and means very little.
Most audio guide analytics fall into this trap. They measure activity, not understanding. They tell you something happened without telling you what it meant.
Part of this is a technology limitation. Traditional hardware players and basic BYOD apps don't generate much data. A visitor presses play, listens, presses stop. The device knows which button was pushed. That's about it.
But there's a deeper problem: even when better data is available, most museums aren't sure what to do with it. The KPIs that get reported (total plays, downloads, language counts) are chosen because they're easy to measure, not because they're useful.
So what actually matters? And what becomes possible when your audio guide generates conversational data instead of play/pause events?
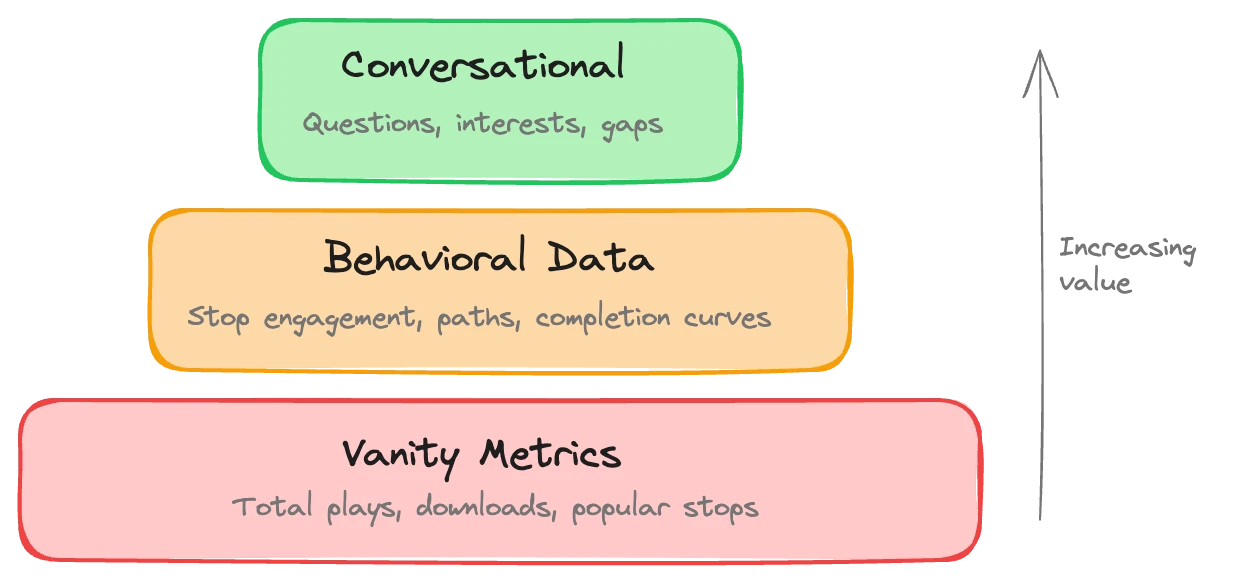
The vanity metrics problem
Walk into any audio guide vendor demo and you'll see a dashboard with numbers that look impressive. Total sessions. Average session duration. Most popular stops. Language breakdown by percentage. Maybe a heat map.
These metrics aren't wrong. They're just shallow. They describe surface behavior without revealing intent, satisfaction, or failure points.
Total plays tells you about distribution, not quality. A guide that 10,000 people started and 9,000 abandoned after one stop isn't performing well, but the headline number looks great.
Average session duration is worse. It blends people who engaged deeply for 45 minutes with people who opened the guide, listened to the intro, and never touched it again. The average of those two experiences is meaningless.
Most popular stop usually just means "the stop closest to the entrance." It reflects foot traffic, not content quality.
None of these answer what a museum professional actually needs to know: Is the content working? Are visitors getting what they came for? Where is the experience falling short?
What you should measure instead
Useful audio guide analytics answer specific questions. Not "how much activity happened" but "what is that activity telling us about our visitors and our content."
Stop-level engagement depth. How did visitors engage with stop 7? Did they listen to the full narration or skip ahead? Did they ask follow-up questions? Did they linger or move on immediately? The difference between a stop that visitors tolerate and one that captures their attention shows up here, if your data is granular enough to see it.
Completion patterns. Where in the tour do people drop off? The overall completion rate matters less than the shape of the drop-off curve. A steep cliff after stop 3 means something different than a gradual taper across the whole tour. The cliff says "something went wrong at stop 3." The taper says "the tour is too long." These require different fixes, but a single "42% completion rate" number hides the distinction.
Tour path adherence. If you designed a specific route, how many visitors follow it? Where do they diverge? Divergence isn't necessarily bad. It might mean a particular gallery is more interesting than your tour sequence assumed. But consistent divergence at the same point tells you the designed path doesn't match how people actually move through the space.
Language distribution with context. Knowing that 30% of sessions are in Japanese is useful. Knowing that Japanese-speaking visitors have a 60% higher engagement rate than English-speaking visitors is far more useful. It might mean your Japanese content is better, or that Japanese visitors are more engaged with audio guides generally, or that English speakers have alternative information sources in the museum. Each explanation leads to different actions.
Engagement duration per stop versus narration length. If people consistently spend less time than the narration takes, the content is too long. If they spend significantly more (asking questions, replaying sections) the content is hitting and they want more. This ratio, tracked per stop, is one of the most useful metrics available.
The conversational layer
Everything above applies to any audio guide that tracks more than play/pause events. Some modern platforms are starting to collect this kind of data.
But there's an entire category of insight that only exists when the audio guide is conversational -- when visitors can ask questions and the system captures what they say, as with an AI audio guide.
Traditional audio guides are one-directional. The museum talks, the visitor listens. The only signal you get is behavioral: they listened, they skipped, they stopped. You're reading body language from a distance.
A conversational guide creates a two-way channel. Visitors tell you what they're thinking. Not through a survey form after the visit, but in the moment, standing in front of the object, driven by real curiosity. That's the rawest, most honest visitor feedback a museum can get.
What people ask about. At every stop, you can see the actual questions visitors pose. A museum might write detailed content about an artwork's provenance and technique, then discover from conversational data that most visitors want to know about the artist's personal life, or how the work connects to something they saw in the previous room, or what it would have looked like when it was first made.
Interest mapping. Aggregate the questions across thousands of visitors and patterns emerge. Certain topics generate consistent curiosity. Certain objects spark more questions than others. Certain connections between works that the museum may not have drawn explicitly keep coming up in visitor questions. That's a map of what your audience actually cares about, generated passively from real behavior.
Topic gaps. When visitors ask questions your content doesn't cover, that's a signal. If hundreds of people ask about the same thing and the guide has to draw on general knowledge rather than museum-provided data, you've found a content gap worth filling. Not a guess about what might be interesting, but evidence that it is.
Curiosity trajectories. Where do visitors go deep? Which topics make them ask follow-up questions, request more detail, spend time in real dialogue? A visitor who asks three questions about a ceramic technique is telling you something different from one who listens passively to the same stop and moves on. At scale, these trajectories reveal which parts of your collection generate real intellectual engagement versus passive consumption.
Feedback you didn't ask for
Something we didn't fully anticipate when we first started analyzing conversational data at Musa: visitors use the audio guide to communicate about things that have nothing to do with exhibits.
If people in Gallery 4 keep asking where the toilets are, that's not an audio guide problem. That's a wayfinding problem. The signage in or near that gallery isn't doing its job.
If visitors near the exit frequently ask about the gift shop (where it is, what's available, whether that print from the exhibition is for sale) that's a merchandising signal. People are in a buying mindset and can't find what they need.
If a cluster of questions come in about accessibility, seating, or "how much longer is this tour," you're getting real-time feedback on visitor fatigue and comfort.
None of this shows up in traditional audio guide data. Play counts don't capture it. Behavioral analytics miss it too, because the questions aren't about the content. But they're there in the conversational stream, and you can act on them.
We tell museums: put everything into the system. Not just exhibit data. Information about the building, the facilities, the shop, the cafe, the architecture, the parking. When visitors can ask about anything and get an answer, you get data about everything they care about. The audio guide becomes an ambient feedback channel for your entire operation.
Language-specific analysis
Multilingual data adds another dimension. Different language groups often engage with the same content in different ways. A Japanese-speaking visitor might ask detailed questions about brush technique in the calligraphy gallery while a French-speaking visitor asks about the historical context. Neither is wrong. Both tell you something about what different audiences value.
When you can break down engagement patterns by language (not just "how many sessions in German" but "what do German-speaking visitors ask about, how deep do they go, where do they drop off") you can tailor content per language group. Maybe your Italian-speaking visitors need more architectural context because that's what drives their interest. Maybe your Mandarin-speaking audience engages most with contemporary art. The data tells you.
This kind of analysis is impossible with traditional guides because there's no interaction to analyze. The visitor listened in Italian. That's all you know. With conversational data, you know what the Italian-speaking visitor was curious about, where they spent extra time, and what they wished the guide had covered.
From analytics to action
Data without action is decoration. So how does this translate to decisions?
Exhibition planning. If conversational data shows persistent interest in a topic that's only tangentially covered in your current collection (say, visitors at a modern art museum consistently asking about the artists' political contexts) that's a signal for a future exhibition focus. Not a guarantee, but a data point that's stronger than a staff member's intuition or a post-visit survey with a 5% response rate.
Content iteration. Stop-level engagement data tells you where to invest time improving. A stop with high traffic but low engagement depth needs better content. A stop with low traffic but deep engagement is a hidden gem. Maybe it deserves a more prominent position in the tour, or better wayfinding to direct visitors there.
Tour design. Path divergence data shows you how visitors actually move, versus how you assumed they'd move. If the designed tour goes A-B-C-D but most visitors go A-B-D-C, maybe the tour sequence should change. Or maybe the transition from B to C isn't clear enough spatially. The data doesn't always tell you the fix, but it reliably tells you where the problem is.
Traffic management. Real-time usage data shows where visitors cluster. If stop 12 consistently creates a bottleneck at 2pm, you can adjust tour routing, stagger start times, or add content at adjacent stops to spread the crowd.
Operational improvements. When the conversational data reveals non-content questions (wayfinding, facilities, comfort) those get routed to the relevant operational team. The audio guide team shouldn't fix the signage, but they can flag the problem with data that's hard to argue with.
What old-school systems can't do
Traditional hardware audio guides, the devices museums have used for decades, generate essentially no analytics. The device gets checked out and checked back in. Maybe you know which device numbers were used. That's it.
Some newer BYOD platforms have started adding traffic-type data: session counts, popular stops, basic usage patterns. Better than nothing, but still surface-level. It's the equivalent of a website tracking page views without any understanding of user behavior.
The gap isn't about having more data. It's about having a different kind of data. Play/pause events tell you about consumption. Conversational data tells you about cognition: what people are thinking, wondering, and wanting when they're standing in your galleries. No amount of play-count sophistication closes that gap. It requires a fundamentally different type of interaction between the visitor and the guide.
Making this real
If you're evaluating audio guide platforms and analytics matters to you (it should) here's what to ask.
Can you see engagement data at the individual stop level, not just aggregate? Can you see what visitors actually ask, not just that they asked something? Can you break down behavior by language, tour type, and time of day? Can the data tell you where content is weak, not just where traffic is high?
And the question that separates conversational analytics from everything else: can you show me what my visitors are curious about?
That last question changes how you think about the audio guide's role. It stops being a content delivery device and becomes a listening tool. Every visitor interaction is a data point about what your audience values, what they're missing, and what you could do better.